Glucose
Your glucose over time
With a CGM connected, Glucose over time on Insights shows the readings your sensor shared, drawn across the week you are looking at.
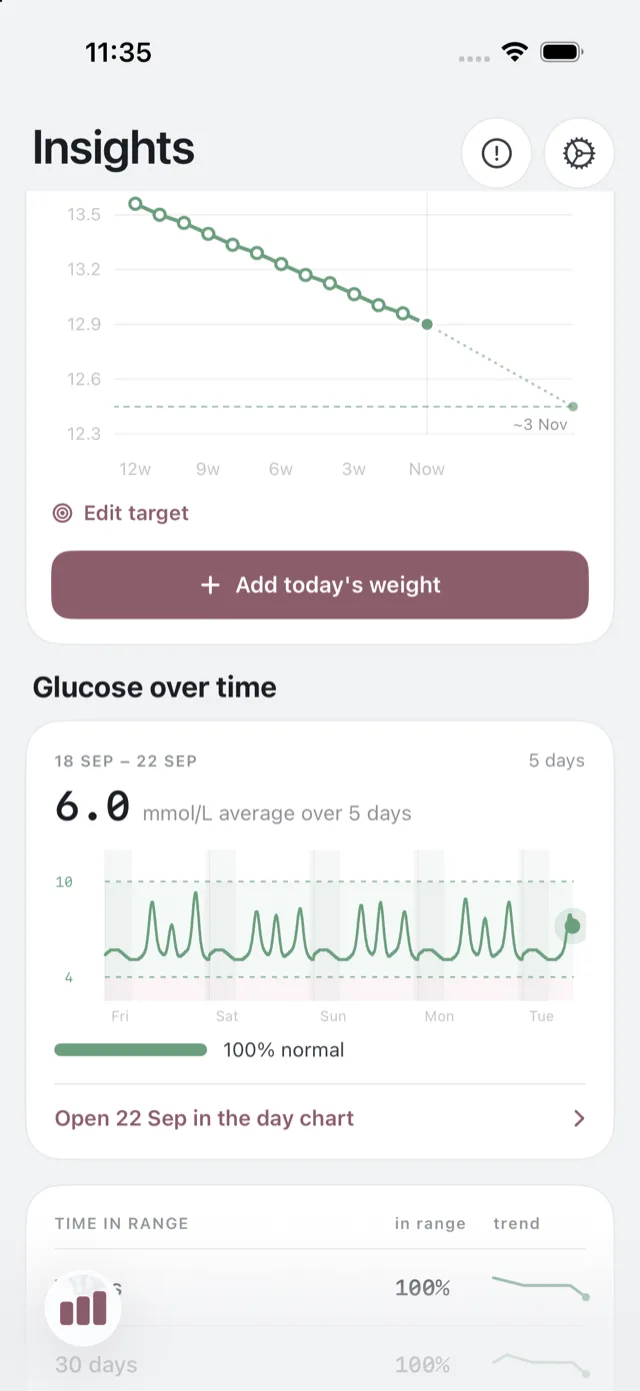
The card
The headline is your average over the window, in mmol/L, with the dates and the number of days it covers. The trace runs underneath it, with the two reference lines at 4 and 10.
The lines at 4 and 10 mmol/L are a scale to read the chart against. They are not a target band, and Bolus is not telling you to stay between them.
Your day
Tap the card to open Your day: your trace hour by hour, with your meals marked along it so you can see what sat around what you ate, and a timeline of the day underneath.
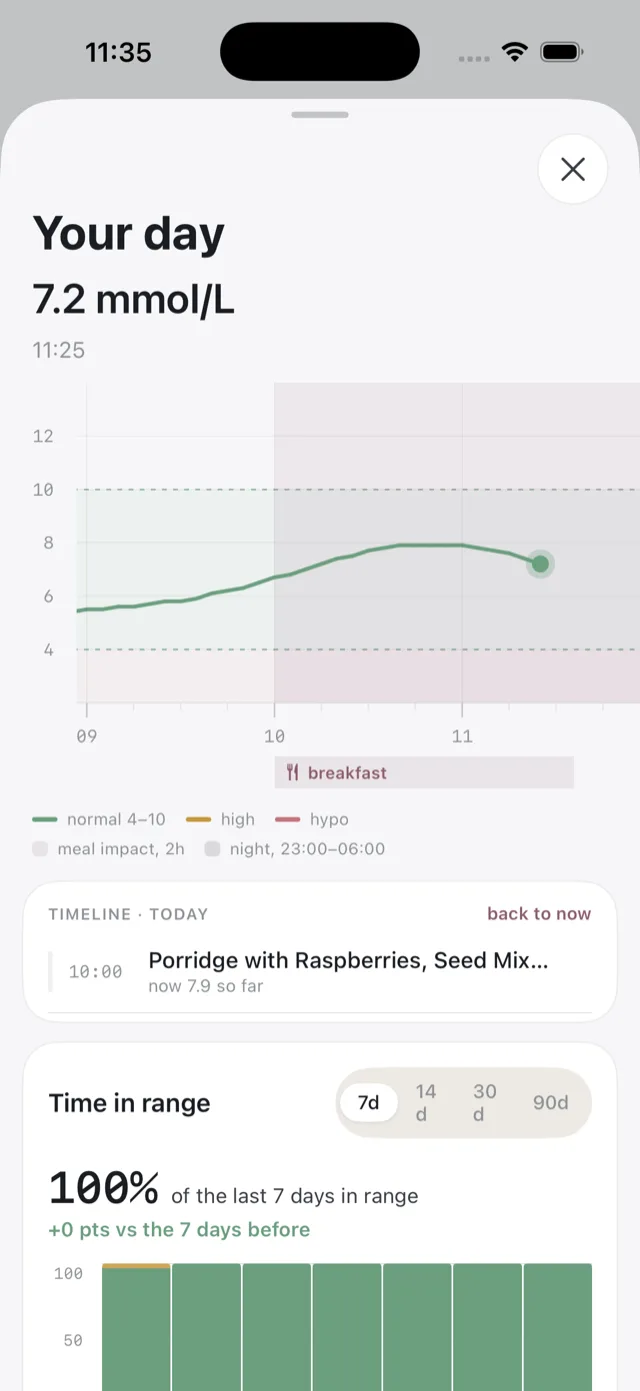
The key names what is drawn: normal 4 to 10, high, hypo, the two-hour window after a meal, and the night block from 23:00 to 06:00.
Time in range
Underneath, Time in range is the share of your readings that sat between 4 and 10, over the last 7, 14, 30 or 90 days. Each bar is one day. A day without a sensor is a gap, not a zero, so a sensor change does not read as a bad day.
Bolus uses the vocabulary consistently: 4 to 10 is normal, above 10 is high, below 4 is a hypo.
Where the range comes from
Time in range follows the widely used international consensus range. It is a population reference, not a target Bolus has set for you. See where our guidance comes from.
What Bolus does with it
Shows it to you. Bolus does not change your meals because of a reading, does not predict your glucose, and gives no dosing guidance. See how your glucose is used.
If it is empty or stale
Almost always a sync issue rather than a fault. See glucose is not updating or looks stale.